There is a house in Happisburgh, Norfolk, that used to have a garden. Then a path. Then a street behind it. Now it has a cliff edge, and that cliff edge is getting closer every winter. UK coastal erosion is not a new problem, but the speed at which it is eating through certain stretches of the British coastline is genuinely alarming, and the technology people are now using to track it in near real-time makes the whole thing feel oddly cinematic. Beautiful and terrifying in roughly equal measure.
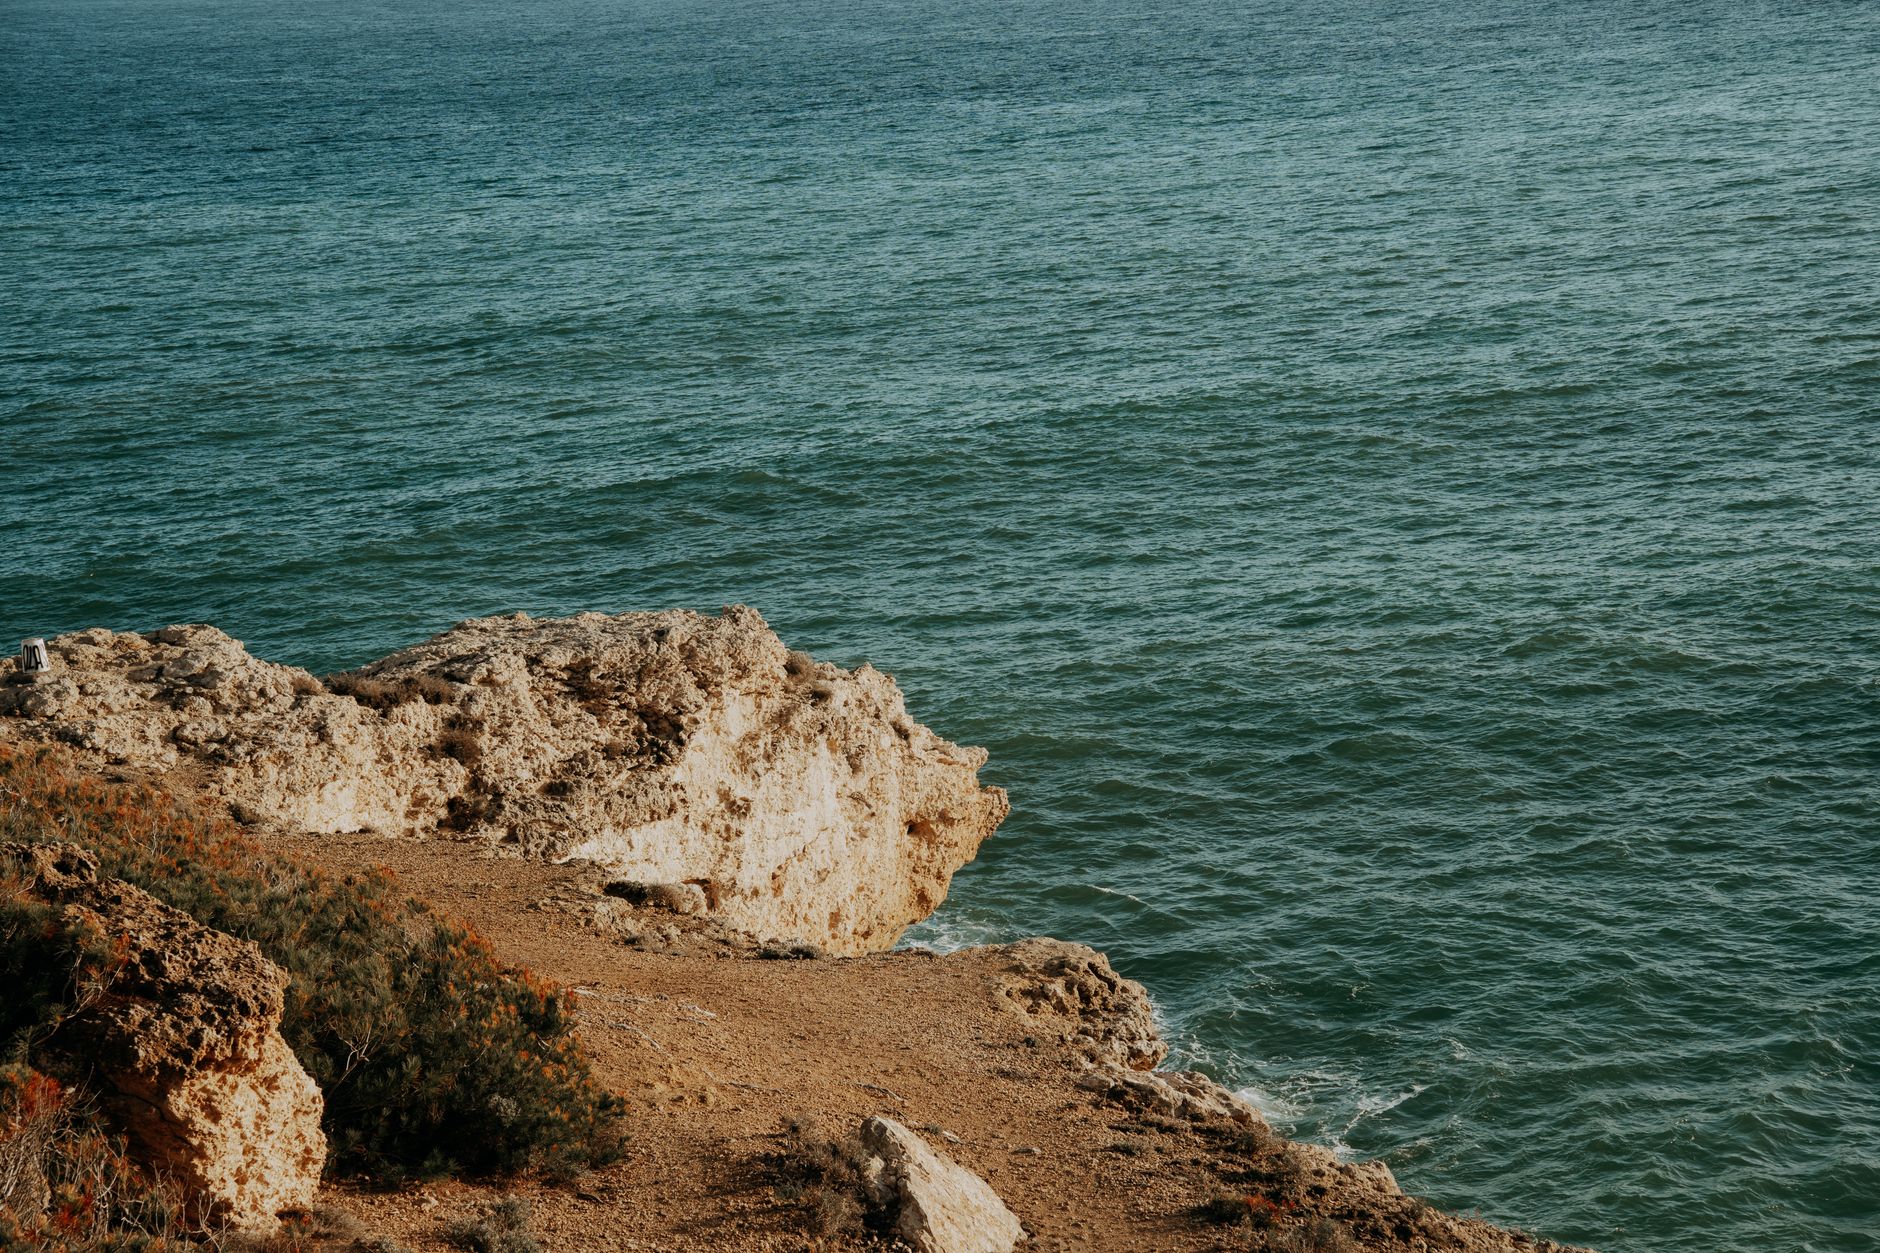
I’ve been fascinated by this for a while. There is something deeply strange about watching a village disappear, not in some dramatic Hollywood collapse, but slowly, quietly, a few metres per year, until the Google Maps pin for a house points to open sea. And that is increasingly possible to watch happen, almost live, thanks to a combination of satellite imagery, Environment Agency data tools, and drone surveys being run by a surprising mix of academics, local councils, and curious residents.
Happisburgh and Skipsea: two of the UK’s fastest-vanishing coastlines
Happisburgh (pronounced, brilliantly, “Hazebruh”) in Norfolk holds the grim distinction of being one of the fastest-eroding coastlines in Europe. The cliffs there are soft clay and sand, and the North Sea has no interest in going gently. According to the Environment Agency’s coastal flood boundary dataset, some sections of the Norfolk coast have lost more than a metre of land per year, averaged over recent decades. In bad winters, that figure can spike dramatically in a matter of days.
Skipsea on the East Yorkshire coast tells a similar story. The Holderness coast between Flamborough Head and Spurn Point is losing land at an average of roughly two metres per year, making it one of the most erosion-prone coastlines in the world. Homes there have been demolished. Roads have simply ended. And the residents who remain are watching the process accelerate as winter storms get more ferocious.
What is new is not the erosion itself but the tools people are using to understand and document it. UK coastal erosion has always happened. The difference now is that anyone with a laptop and an internet connection can watch it happen in granular detail.
How satellite imaging is letting residents track the cliff edge
The British Geological Survey runs the National Coastal Erosion Risk Mapping programme, which pulls together data from satellite imagery, aerial photography, and Lidar (light detection and ranging) scans to produce some seriously detailed pictures of how coastlines are shifting. Lidar, in particular, is extraordinary. It bounces laser pulses off the ground and can detect elevation changes of just a few centimetres across huge stretches of coastline. Fly a Lidar-equipped aircraft or drone over Happisburgh in January and again in March, and you can see exactly how much the cliff receded during those two months.
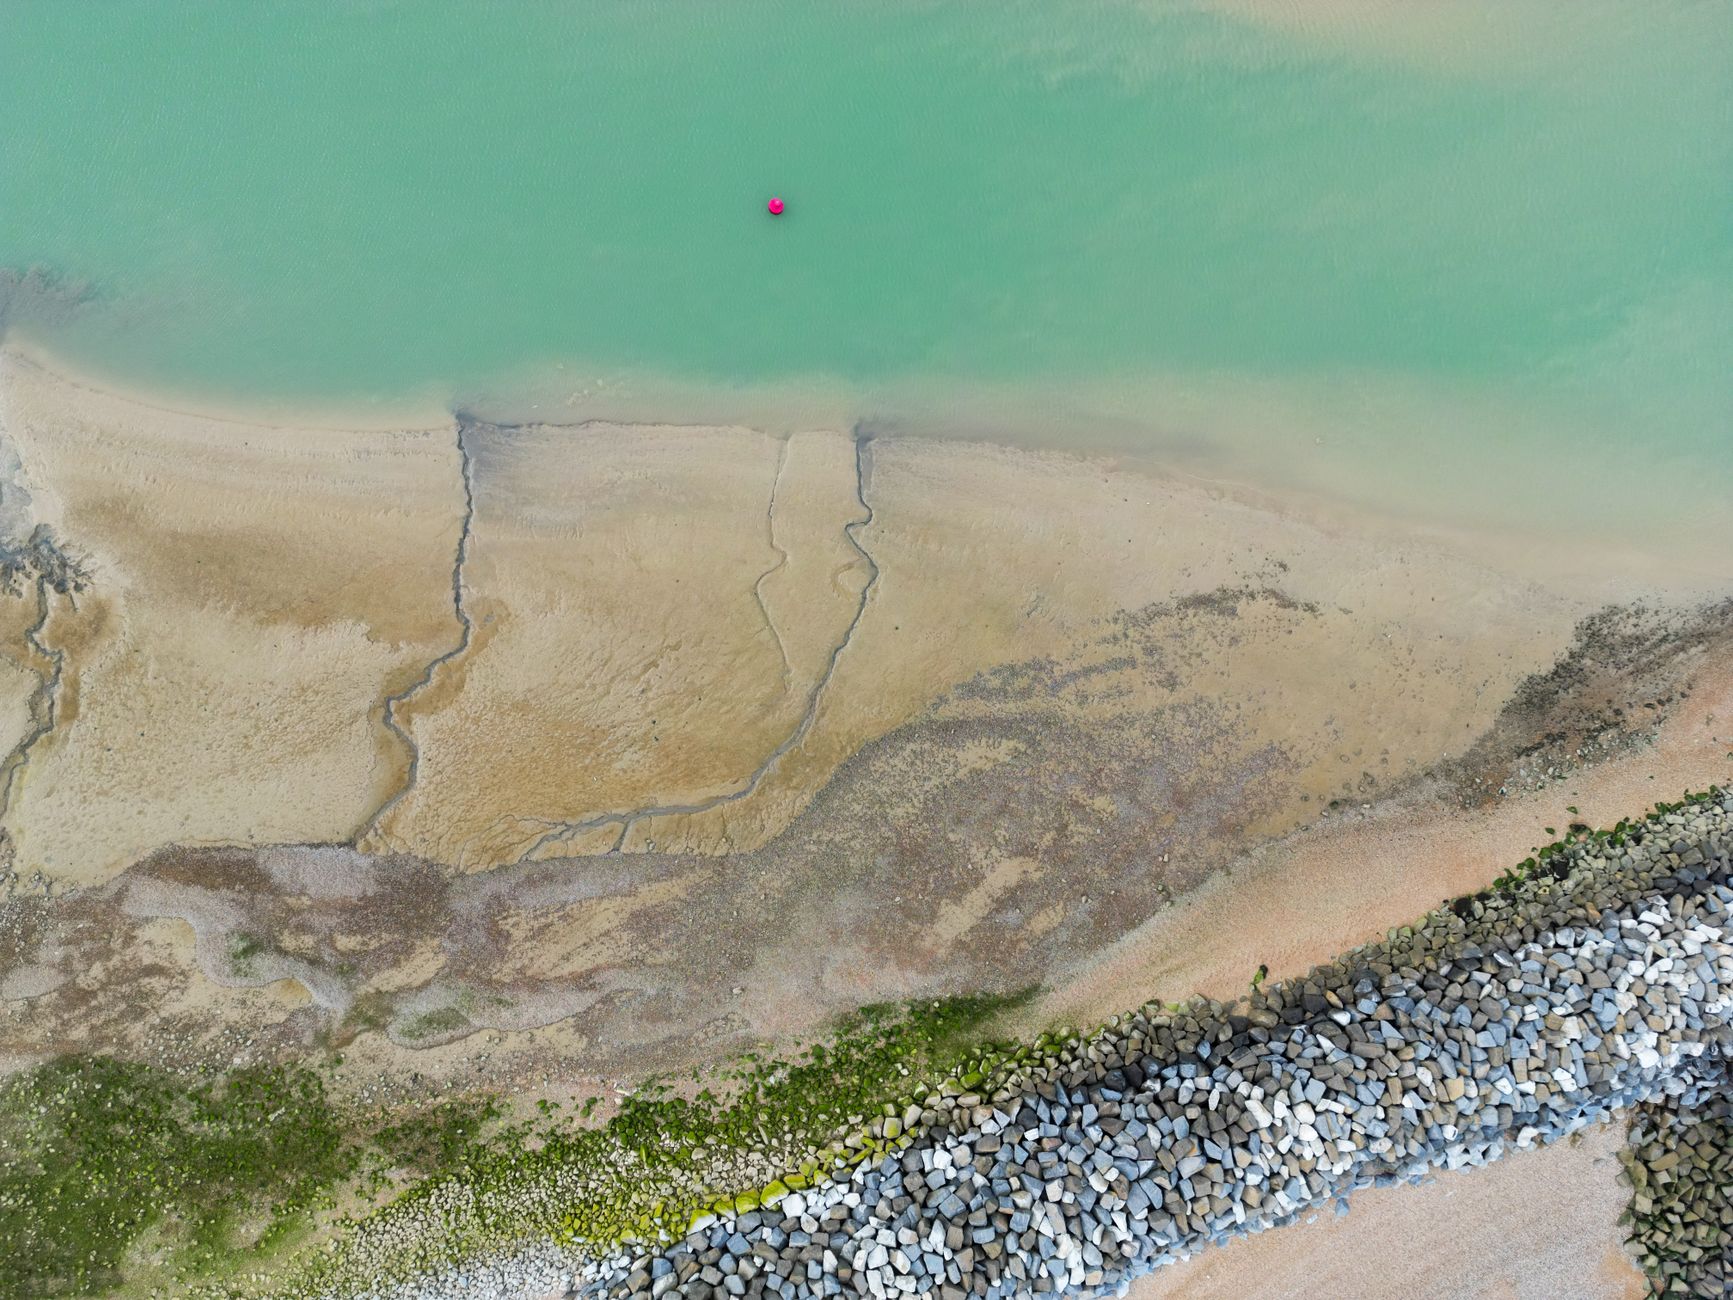
Meanwhile, the European Space Agency’s Copernicus programme provides satellite imagery that researchers at universities like Plymouth and Exeter have been using to build change-detection models. These compare images taken weeks or months apart and flag areas where the land boundary has shifted. Some of these tools are now publicly accessible, meaning local residents in at-risk communities can check in on their own stretch of coastline without waiting for a government report.
Drone surveys are another big piece of this. Coastal communities and local councils have started commissioning drone flights to produce photogrammetry models, essentially 3D reconstructions of the cliff face built from hundreds of overlapping photographs. Do this twice a year and you have a precise, measurable record of exactly what the sea has taken. I’d argue this kind of localised data is actually more useful to individual homeowners than the national-scale datasets, because it captures the specific geography of their bit of coast rather than averaging across miles of it.
The emotional reality of watching your village vanish
Behind all this tech is something genuinely heartbreaking. Residents in places like Happisburgh have been fighting for coastal defences for decades, largely unsuccessfully, because the Environment Agency’s managed retreat policy means some stretches of coast are essentially considered not worth defending economically. That is a brutal calculation to absorb if your home is the thing being retreated from.
The data tools have given communities a new kind of leverage. When you can show a council or a government minister a precise, timestamped 3D model of how much cliff has gone since the last meeting, it is harder to dismiss the urgency. Local groups in Happisburgh have used this kind of evidence in their campaigns, and similar efforts are underway in Skipsea, Withernsea, and along parts of the Suffolk coast near Covehithe.
There is also, it has to be said, a slightly surreal community of people who document this stuff online. Forums, YouTube channels, and social media accounts dedicated to coastal erosion photography. People who drive to Holderness after every big storm to photograph the latest collapse. I understand the impulse entirely. There is something primal about watching geology happen at human speed.
What the data actually tells us about the future
The honest answer is that UK coastal erosion is going to get worse before any intervention slows it down. Rising sea levels compound everything. A coast that was losing a metre per year might lose significantly more as tidal baselines shift. The Environment Agency’s own long-term projections for the east coast of England are sobering reading.
Technology cannot stop the sea, obviously. But it can buy communities time, give them evidence, and help planners make better decisions about where to build, where to defend, and where to let nature take its course. Some of the same principles apply in other areas of environmental monitoring: the AI tools UK councils are using to spot potholes before they cause accidents use similar change-detection logic, just applied to tarmac rather than cliff faces. The underlying idea, catching small problems before they become catastrophic ones, is the same.
The Environment Agency has also been developing its Shoreline Management Plans, long-term strategies for different stretches of coast that now incorporate far richer data than previous versions. It is dry reading but genuinely important stuff if you live anywhere near a crumbling cliff.
There is one slightly odd footnote to all this data collection: the sheer volume of imagery and environmental monitoring data being generated by coastal communities has created its own logistical challenges. Storing, processing, and sharing gigabytes of drone footage and satellite imagery requires decent infrastructure. Coastal monitoring groups have started thinking carefully about data management in the same way any small organisation has to, which is a rather mundane concern sitting alongside the dramatic backdrop of cliffs falling into the sea. Even the most committed volunteer surveyor still has to deal with full hard drives, and I imagine the recycling logistics alone are a headache. Groups like The Bin Boss have nothing to do with cliff faces, but the broader point that managing the physical infrastructure of any operation matters stands.
What the satellite and drone revolution has genuinely done is democratise geological awareness. Thirty years ago, only specialist researchers knew the precise rate at which Skipsea was vanishing. Now a retired teacher in East Yorkshire can pull up a Lidar comparison on a Tuesday afternoon and know exactly how much their village has shrunk since last winter. That knowledge is uncomfortable. It is also, in a strange way, a form of power. And for communities that have often felt ignored by policymakers, having the receipts, literally timestamped images of a coastline being consumed, changes the conversation.
The sea will keep doing what it does. But at least now we can watch it do it, in extraordinary detail, and maybe, just maybe, make slightly better decisions about what comes next. I find that bleakly hopeful. Which is, honestly, the most you can ask for when a village is edging towards the cliff.
Frequently Asked Questions
Which parts of the UK coastline are eroding the fastest?
The Holderness coast in East Yorkshire and the Norfolk coast around Happisburgh are among the fastest-eroding in Europe. Holderness loses roughly two metres of land per year on average, whilst parts of the Norfolk coast can lose over a metre annually, with much higher rates during severe winter storms.
How can I check if my coastal property is at risk from erosion?
The Environment Agency’s Shoreline Management Plans and the National Coastal Erosion Risk Mapping programme both provide publicly accessible data. You can search by location to see the projected erosion risk over the coming decades. Your local council’s planning department will also hold relevant coastal risk assessments.
What technology is used to monitor UK coastal erosion?
The main tools are Lidar surveys (laser scanning from aircraft or drones), satellite imagery from programmes like the European Space Agency’s Copernicus, and photogrammetry drone surveys that produce 3D models of cliff faces. These are compared over time to measure how much land has been lost between surveys.